empty
 
 
17.03.2023 05:52 PM
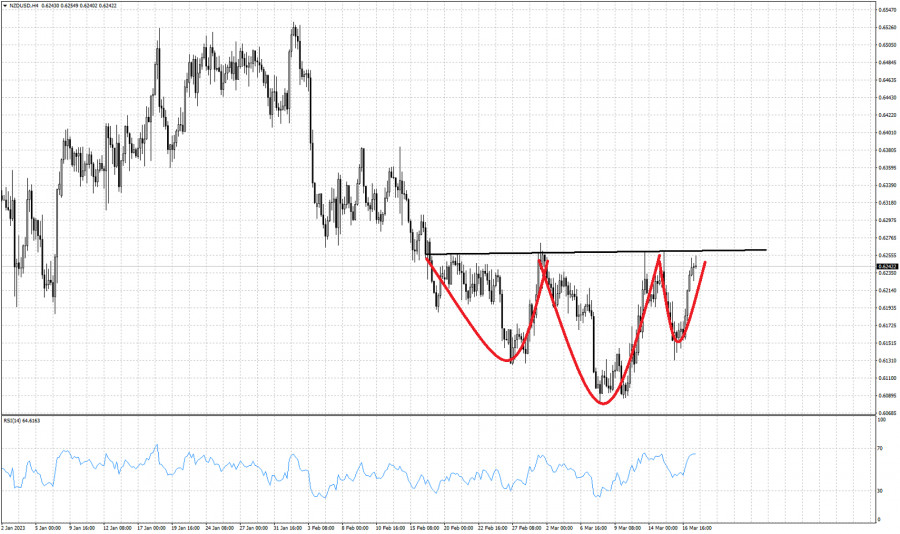
Inverted head and shoulders pattern in NZDUSD.

This image is no longer relevant

Black line- neckline resistance

Red lines- Head and shoulders pattern

NZDUSD is trading around 0.6240 after bouncing from recent low at 0.6131. In the 4 hour chart we observe that the recent bounce was part of a right hand shoulder of a bigger inverted head and shoulders pattern. Price has now reached the neckline resistance of the pattern. For this bullish pattern to be activated we need to see a break above the neckline resistance. This neckline resistance level has so far been tested 5 times. Current price action confirms the importance of this resistance. The bullish pattern gets cancelled if price breaks below the right hand shoulder low of 0.6131. If resistance is broken, our target will be at 0.6440.

NZDUSD
New Zealand Dollar vs US Dollar
Select timeframe
5
min
15
min
30
min
1
hour
4
hours
1
day
1
week
Start trade
Start trade
  • Grand Choice
    Contest by
    InstaForex
    InstaForex always strives to help you
    fulfill your biggest dreams.
    JOIN CONTEST
  • Chancy Deposit
    Deposit your account with $3,000 and get $8000 more!
    In March we raffle $8000 within the Chancy Deposit campaign!
    Get a chance to win by depositing $3,000 to a trading account. Having fulfilled this condition, you become a campaign participant.
    JOIN CONTEST
  • Trade Wise, Win Device
    Top up your account with at least $500, sign up for the contest, and get a chance to win mobile devices.
    JOIN CONTEST
  • 100% Bonus
    Your unique opportunity to get a 100% bonus on your deposit
    GET BONUS
  • 55% Bonus
    Apply for a 55% bonus on your every deposit
    GET BONUS
  • 30% Bonus
    Receive a 30% bonus every time you top up your account
    GET BONUS

Recommended Stories

EURUSD, H4 | Potential Reversal from a key level?

The EUR/USD chart is displaying bearish momentum, indicating a potential drop from the multi-swing high resistance level at 1.0927, coinciding with a 78.60% Fibonacci retracement. The first support level

Dean Leo 08:14 2023-03-31 UTC+2

WTI, H4 | Potential bearish reversal?

WTI crude oil prices are currently bearish and may drop towards the first support at 71.15, while facing resistance at 74.07. Key support levels include a significant overlap support

Dean Leo 08:13 2023-03-31 UTC+2

Analysis of Silver for March 31,.2023 - Tight sideways range breakout

Technical analysis: Silver has been trading sideways in the last 10 hours and I see potential for the downside breakout and downside correction to start. Due to the breakout

Petar Jacimovic 07:56 2023-03-31 UTC+2

USD/CAD analysis for March 31, 2023 - Potential for the downside continuation

Technical analysis: USD/CAD has been trading downside as I expected and the price has reached the first downside objective at 1.3517. I still see potential for the downside continuation

Petar Jacimovic 07:51 2023-03-31 UTC+2

Trading Signal for GBP/USD for March 31, 2023: sell below 1.24 or if pullback at 1.2451 (21 SMA - 6/8 Murray)

A daily close and a sharp break below 1.2329 (5/8 Murray) could be a sign of a reversal and trend change and the pound could reach the area of 4/8

Dimitrios Zappas 06:19 2023-03-31 UTC+2

Forecast for EUR/USD on March 31, 2023

Investors switched from policy expectations from the Federal Reserve to the European Central Bank. Yesterday's German inflation report gave them reason to believe that the ECB will continue to tighten

Laurie Bailey 05:42 2023-03-31 UTC+2

Forecast for GBP/USD on March 31, 2023

After the pound settled above the MACD indicator line on the daily chart on Wednesday, it rose by 74 points on Thursday, and this morning, GBP reached the target level

Laurie Bailey 05:42 2023-03-31 UTC+2

Forecast for AUD/USD on March 31, 2023

The Australian dollar broke through the upper limit of the neutral range that started back on March 17. AUD climbed out of this range this morning. It could fall

Laurie Bailey 05:41 2023-03-31 UTC+2

USD/CAD: downside continuation in cards

The USD/CAD pair crashed in the short term and now is trading at 1.3536 at the time of writing. You knew from my previous analysis that the price could approach

Ralph Shedler 20:46 2023-03-30 UTC+2

March 30, 2023 : EUR/USD daily technical review and trading opportunities.

The price level of 1.0930 remained a significant resistance level to offer SELL opportunities until the recent upside movement temporarily extended up to 1.1000. That's why, the next target

Mohamed Samy 19:54 2023-03-30 UTC+2
Can't speak right now?
Ask your question in the chat.