EUR/USD Analysis 5M
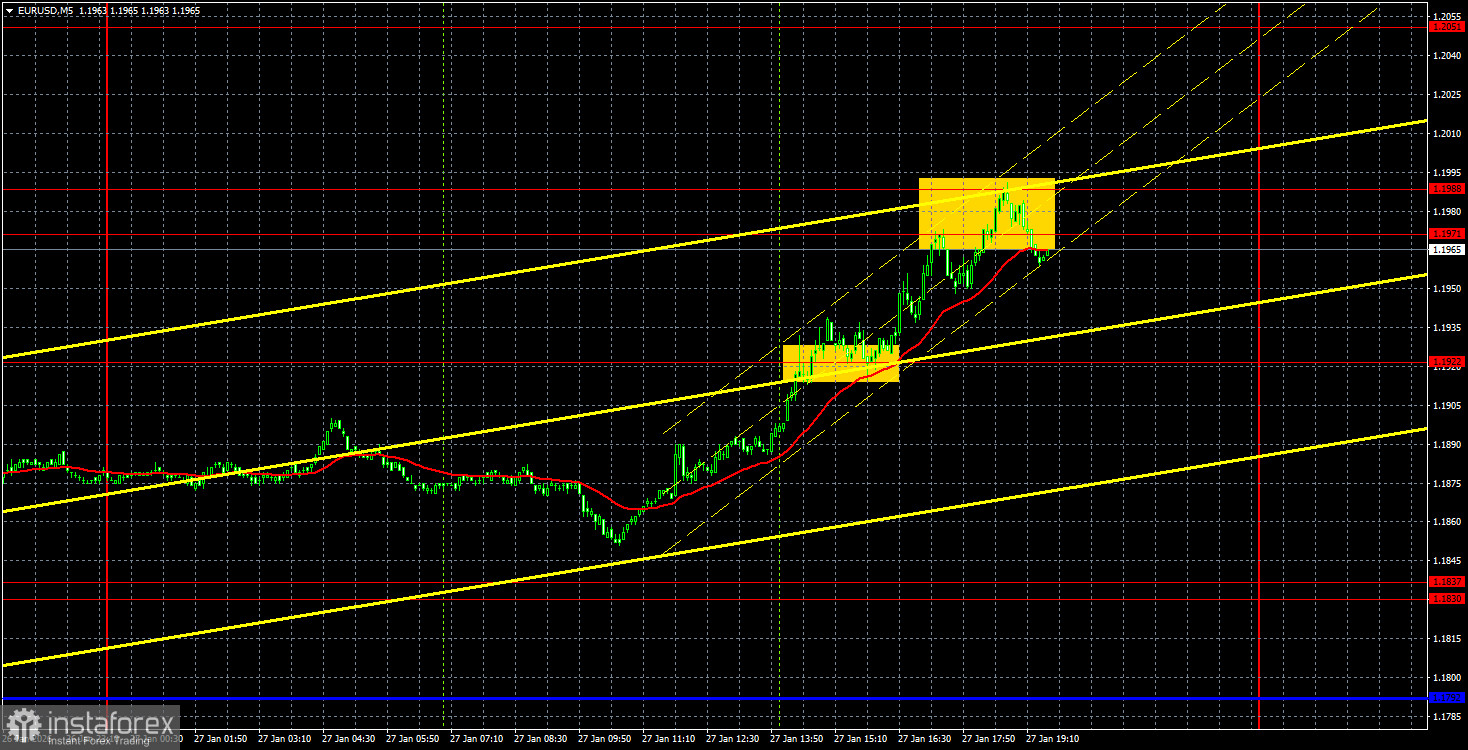
The EUR/USD currency pair continued its upward movement on Tuesday after a brief pause. The macroeconomic backdrop was virtually absent in the Eurozone and the US yesterday, so the dollar's further decline cannot even theoretically be linked to any reports. The market simply continues to sell the dollar almost without interruption. This is the scenario we warned traders about. Once the seven-month flat concludes, the trend of 2025 will resume. At that point, the pair won't need any local news to continue moving upward. Moreover, the reasons to sell the US currency are only increasing day by day.
After Greenland, Donald Trump has shifted his attention to Canada. After Canada, it will be South Korea. When the US president completes his global tour, he will resume imposing tariffs. Additionally, Trump openly states that he wants to see a cheaper dollar. Well, if the president himself believes this, what can traders do? Essentially, the US government has given the green light to devalue the national currency. Denying this fact is pointless. On the hourly timeframe, the pair's rise is so strong that it prevents the construction of a trend line. Volatility has increased significantly since the flat ended. Everything has unfolded as we predicted.
On the 5-minute timeframe, the first buy signal was generated yesterday at the beginning of the American trading session. The pair broke through the 1.1922 level and continued its upward movement, reaching the 1.1971-1.1988 area. This is far from being the peak growth for the European currency.
COT Report
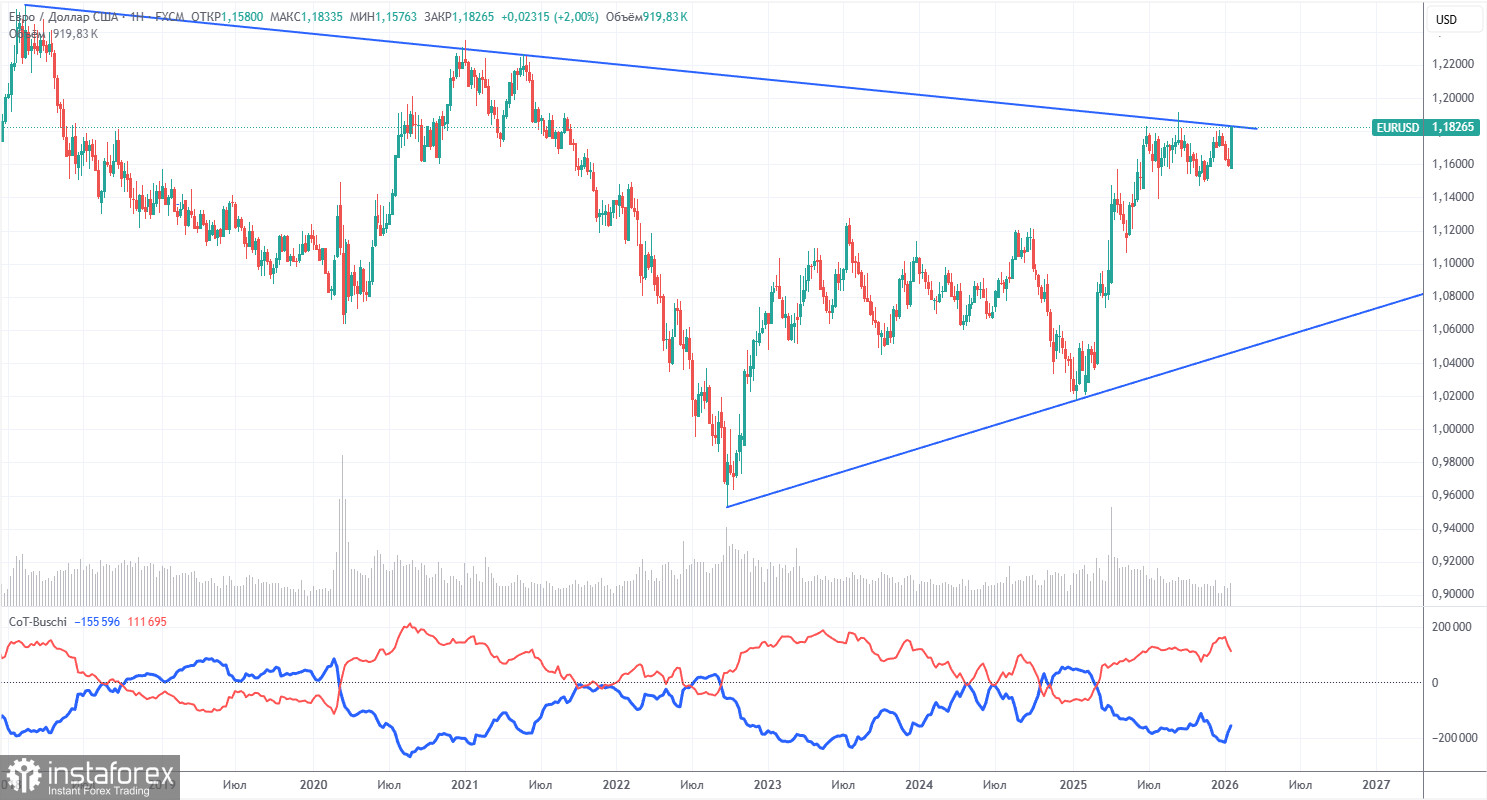
The latest COT report is dated January 20. The illustration above clearly shows that the net position of non-commercial traders remains "bullish." Since Trump took office as president of the United States for the second time, only the dollar has been declining. We cannot say with 100% certainty that the decline of the American currency will continue, but current developments around the world suggest this is a possibility.
We still do not see any fundamental factors supporting the strengthening of the European currency, but there are sufficient factors for the decline of the American currency. The global downward trend is still in place, but how significant is it in terms of where the price has moved in the last 18 years? A new upward trend has been forming over the last three years, and in the coming weeks, the price may break through the global descending trend line, which would confirm further long-term growth.
The positioning of the red and blue lines of the indicator continues to indicate a sustained bullish trend. Over the last reporting week, long positions in the "Non-commercial" group decreased by 8,400, while short positions increased by 12,600. Consequently, the net position declined by 21,000 contracts over the week.
EUR/USD Analysis 1H
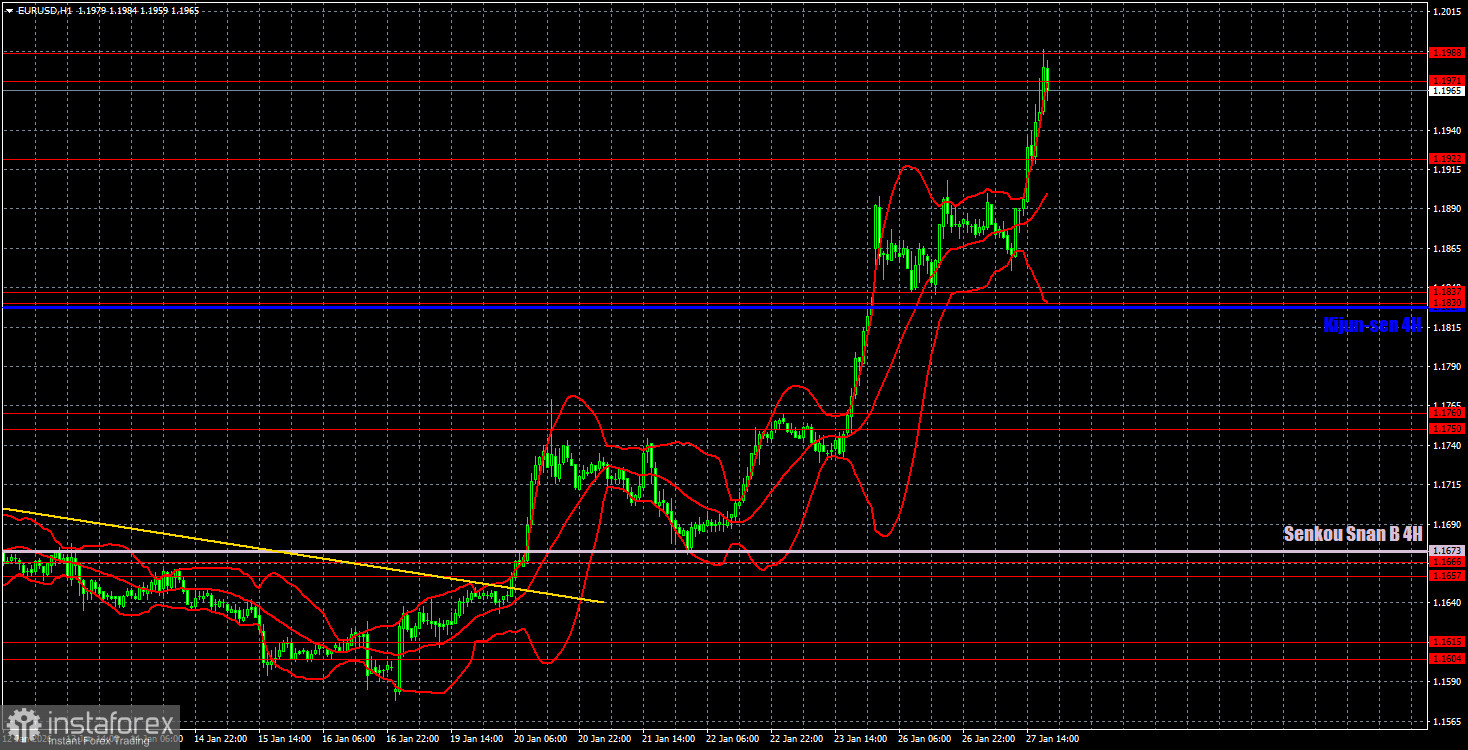
On the hourly timeframe, the EUR/USD pair continues to form a new upward trend. The pair has officially exited the sideways channel of 1.1400-1.1830, where it spent seven months. Thus, we still expect the European currency to continue growing in the near future. As mentioned, the trade war will escalate, and Trump will continue to use tariffs as the main tool to push his interests.
For January 28, we identify the following levels for trading: 1.1362, 1.1426, 1.1542, 1.1604-1.1615, 1.1657-1.1666, 1.1750-1.1760, 1.1830-1.1837, 1.1922, 1.1971-1.1988, 1.2051, and 1.2095, along with the Senkou Span B line (1.1673) and Kijun-sen (1.1827). The Ichimoku indicator lines may shift throughout the day, which should be taken into account when determining trading signals. Don't forget to set your stop-loss orders to break-even once the price moves in the correct direction by 15 pips. This will protect against potential losses if the signal turns out to be false.
On Wednesday, no significant events are scheduled in the Eurozone, while the Fed meeting will occur in the US. The Fed meeting is always important and interesting, but under the current circumstances, the market is fully focused on Donald Trump. By the way, the stability of the Fed's operations depends on Trump. Therefore, we believe that the Fed meeting will not positively influence the dollar under any circumstances.
Trading Recommendations:
On Wednesday, traders may trade in the area of 1.1971-1.1988. New longs will become relevant upon consolidation above this area with targets at 1.2051 and 1.2095. Short positions can be considered on a bounce from this area, targeting 1.1922.
Explanations for the Illustrations:
- Support and resistance price levels are thick red lines around which the movement may end. They are not sources of trading signals.
- The Kijun-sen and Senkou Span B lines are Ichimoku indicator lines shifted to the hourly timeframe from the 4-hour timeframe. They are strong lines.
- Extreme levels are thin red lines from which the price previously bounced. They are sources of trading signals.
- Yellow lines represent trendlines, trend channels, and any other technical patterns.
- Indicator 1 on the COT charts shows the size of the net position for each category of traders.