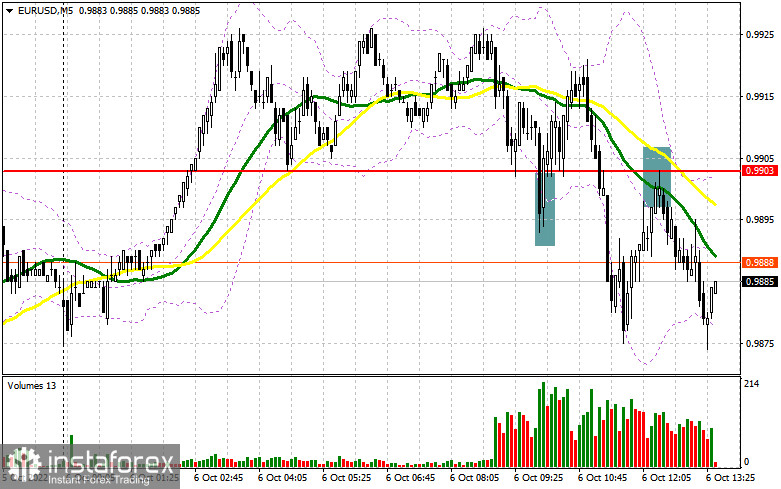
In my morning forecast, I paid attention to the 0.9903 level and recommended deciding on entering the market there. Let's look at the 5-minute chart and figure out what happened there. The decline to the area of 0.9903 did not take long to complete. At the first test, the bulls defended this level, even forming a signal to enter the market for long positions, which increased by 17 points. However, the pair did not get a continuation, and a breakdown occurred on the second test of 0.9903. The bottom-up update of this range led to a good entry point into short positions, which has already resulted in a downward movement of 25 points at the time of writing. From a technical point of view, the situation has changed only slightly.
To open long positions on EURUSD, you need:
The second half of the day is unlikely to be full of surprises, as only a report on the weekly number of initial applications for unemployment benefits in the United States is expected, as well as speeches by FOMC members Charles Evans and Lisa D. Cook. Market participants will surely not force events and will prepare for tomorrow's data on the US labor market. Against this background, I expect pressure to remain on the euro, which may soon return to the 0.9855 area. The formation of a false breakdown there forms a rather interesting signal to buy the euro with the aim of further growth of the pair at intermediate resistance of 0.9903, where the moving averages are already playing on the sellers' side. Consolidation above this range and a top-down test will cancel out all the morning efforts of the bears to control the market, which will lead to a buy signal and recovery in the 0.9948 area. A breakthrough in this area will also allow a direct road to 0.990, but the farthest target will be the 1.0040 area, where I recommend fixing the profits. With the option of a EUR/USD decline after strong statistics on the US labor market and hawkish comments from Fed representatives, a break of 0.9855 will quickly push the euro down to the next support of 0.9807. I also recommend buying only on a false breakdown. I advise you to open long positions on EUR/USD immediately for a rebound only from the minimum of 0.9761 or even lower – around 0.9725 – with the aim of an upward correction of 30–35 points within a day.
To open short positions on EURUSD, you need:
Sellers are aiming at 0.9855, and it seems that a test at this level cannot be avoided. But a much more important task for the second half of the day will be to protect the nearest resistance of 0.9903, from which several entry points into the market have already been formed this morning. Weak statistics in the US are unlikely to harm the dollar much, but at the moment, all this may increase the risk appetite, which will lead to an update of this range. By analogy with what I analyzed above, only a false breakout at 0.9903 forms a sell signal to reduce to the level of 0.9855. A breakdown and consolidation below this range will pressure the euro before tomorrow's important data. A reverse test from the bottom up will form an additional sell signal with the demolition of buyers' stop orders and the prospect of updating the 0.9807 minimum. A more distant goal will be the support of 0.9761, where I recommend fixing the profits. In the event of an upward movement of EUR/USD during the US session, as well as the absence of bears at 0.9903, which is more likely, buyers will gain an advantage, which will lead to a correction of the euro to the highs of 0.9948 and 0.9990. There I advise you to sell only on a false breakdown. It is possible to open short positions immediately for a rebound only from 1.0040 or even higher – from 1.0080 with the aim of a downward correction of 30–35 points.
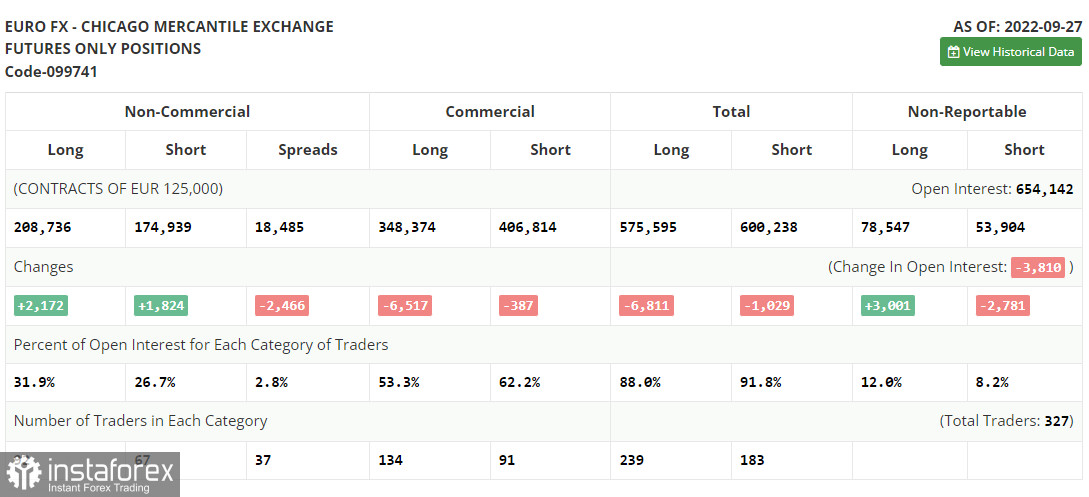
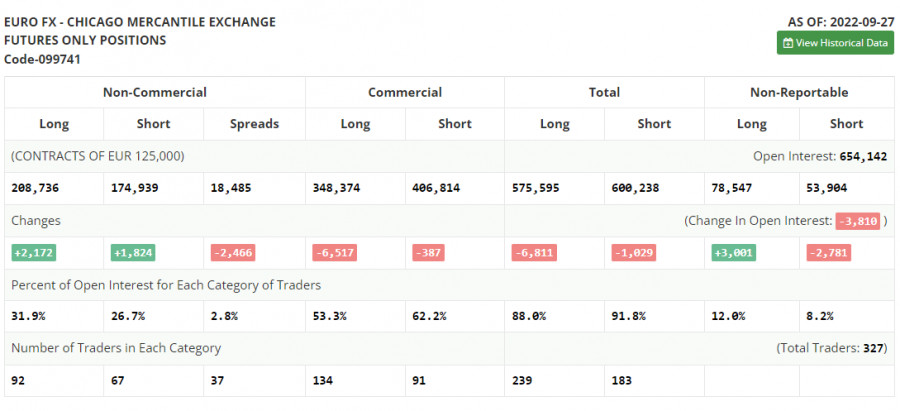
The COT report (Commitment of Traders) for September 27 recorded an increase in both short and long positions. The central bank meetings have been held, and given that the euro has withstood the pressure generated by the statements of European and American politicians last week, we can count on a gradual recovery of the pair in the short term. However, you should not delude yourself too much. As is already known, inflation in the EU countries has already exceeded 10.0%, and in the autumn-winter period, the situation with this indicator will only worsen. For this reason, I would not bet on strong euro growth. The deterioration of the geopolitical situation in the world, which mostly concerns the eurozone, will greatly slow down the European economy in the near future and will certainly lead it to recession in the spring of next year. In the near future, it is expected that important data on activity in the eurozone countries will be released, the decline of which may significantly limit the further upward potential of the pair. The COT report indicated that long non-profit positions rose by 2,172 to 208,736, while short non-profit positions jumped by 1,824 to 174,939. At the end of the week, the total non-commercial net position remained positive and amounted to 33,797 against 33,449. This indicates that investors are taking advantage of the moment and continuing to buy the cheap euro below parity, as well as accumulate long positions to end the crisis and restore the pair in the long term. The weekly closing price collapsed and amounted to 0.9657 against 1.0035.
Signals of indicators:
Moving Averages
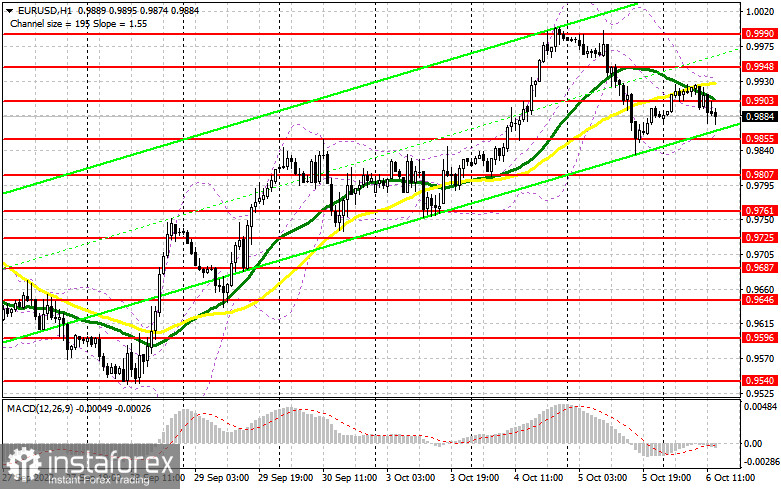
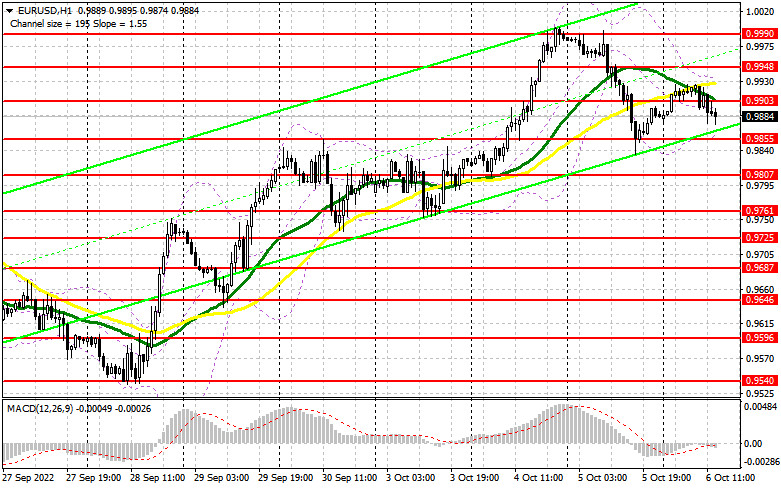
Trading is below the 30 and 50-day moving averages, which indicates continued pressure on the euro.
Note: The author considers the period and prices of moving averages on the hourly chart H1 and differ from the general definition of the classic daily moving averages on the daily chart D1.
Bollinger Bands
In the case of growth, the upper limit of the indicator at around 0.9935 will act as resistance.
Description of indicators
- Moving average (moving average determines the current trend by smoothing out volatility and noise). Period 50. The graph is marked in yellow.
- Moving average (moving average determines the current trend by smoothing out volatility and noise). Period 30. The graph is marked in green.
- MACD indicator (Moving Average Convergence / Divergence - moving average convergence/divergence) Fast EMA period 12. Slow EMA period 26. SMA period 9
- Bollinger Bands (Bollinger Bands). Period 20
- Non-profit speculative traders, such as individual traders, hedge funds, and large institutions use the futures market for speculative purposes and to meet certain requirements.
- Long non-commercial positions represent the total long open position of non-commercial traders.
- Short non-commercial positions represent the total short open position of non-commercial traders.
- Total non-commercial net position is the difference between the short and long positions of non-commercial traders.