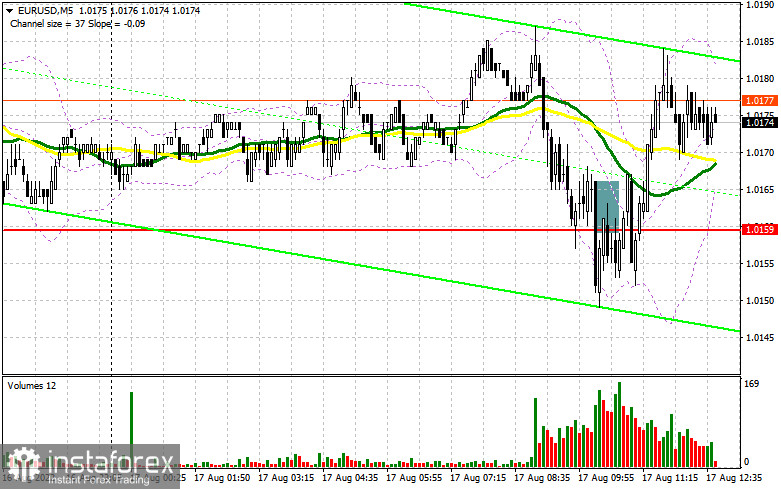
In the morning article, I highlighted the level of 1.0159 and recommended making decisions with this level in focus. Now, let's look at the 5-minute chart and try to figure out what actually happened. A sell signal appeared after a decline of the pair to 1.0159 in the first half of the day and an upward test. Unfortunately, this signal brought losses as I did not expect the pair to fall further. Closer to the middle of the day, the bulls pushed the price above 1.0159. Therefore, I had to revise the technical outlook.
What is needed to open long positions on EUR/USD
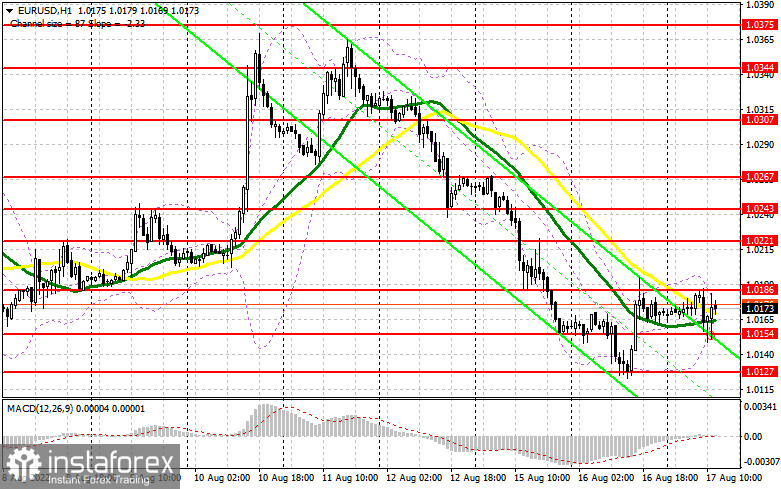
Traders paid zero attention to the Eurozone's GDP data even though the second-quarter GDP reading was slashed. Apparently, nobody expects the economy to accelerate in the third quarter as it is gradually sliding into a recession due to soaring inflation and rate hikes. In the autumn, the situation could worsen significantly when energy prices go up again. Today, traders are anticipating the FOMC meeting minutes for July. They may provide more hints about the Fed's future plans for monetary policy. It may also reveal whether the Fed is going to hike the key rate in the autumn. If the minutes are less hawkish than expected, the euro may assert strength. If the pair drops, only a false breakout of 1.0154 will give a buy with the prospect of a rise to the nearest resistance level of 1.0192. Yesterday, the bulls failed to push the pair above this level. A breakout and a downward test of this level along with a dovish tone of the minutes will force the bears to close their Stop Loss orders. As a result, an additional buy signal may appear with the possibility of an increase to 1.0221. A more distant target will be a new high of 1.0243 where I recommend locking in profits. If EUR/USD slides and buyers show no activity at 1.0154, the pressure on the pair will escalate. Notably, the price has already tried to break through this level today. In this case, the bullish sentiment may lose steam. The best option for opening long positions will be a false breakout of 1.0127. You can buy EUR/USD immediately at a bounce from 1.0099 or a low of 1.0045, keeping in mind an upward intraday correction of 30-35 pips.
What is needed to open short positions on EUR/USD
Apart from the FOMC meeting minutes, investors are sure to take notice of US retail sales data. If the reading drops in July, it may undermine a rally of the US dollar. It will be rather bullish for the euro. So, it could grow to 1.0192. If big sellers are present in the market, they will easily defend this level. The optimal scenario for opening short positions will be a false breakout of the resistance level of 1.0192. If so, the euro could decline to 1.0154. A decrease below this level and an upward test will provide an additional sell signal. The bulls will have to close their Stop Loss orders, pushing it to 1.0127. After a slide below this level, the likelihood of an uptrend will be low. Therefore, the price could touch 1.0099 and 1.0073 where I recommend closing all short positions. A more distant target will be the 1.0045 level. If EUR/USD rises during the US session and bears show no energy at 1.0192, the bulls are likely to regain ground. Weak retail sales data could also help the euro climb higher. In this case, I would advise you to postpone short positions to 1.0221 but only if a false breakout occurs. You can sell EUR/USD immediately at a bounce from a high of 1.0243 or 1.0267, keeping in mind a downward correction of 30-35 pips.
COT report
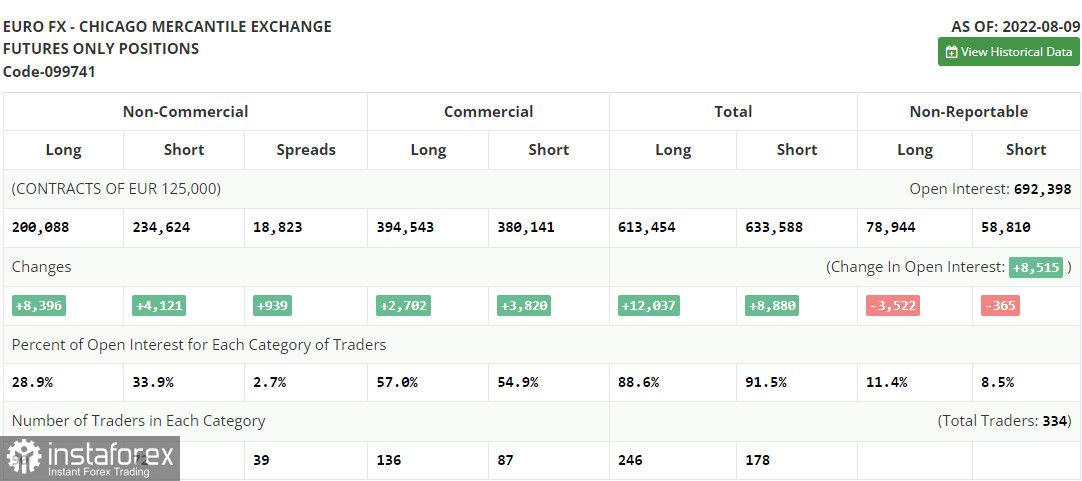
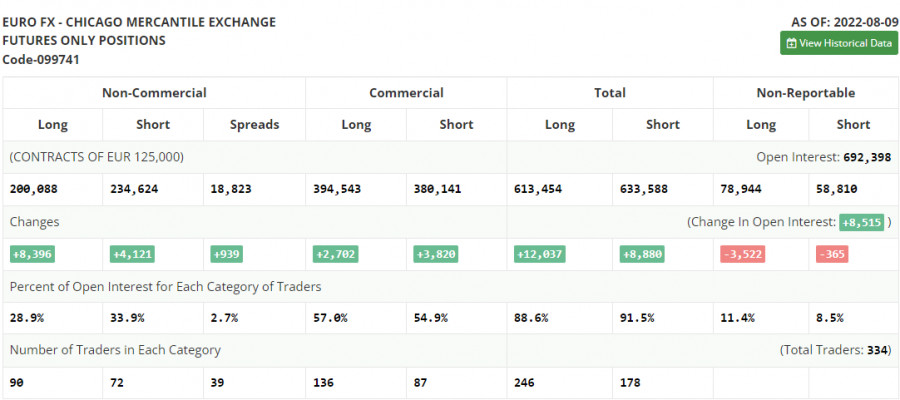
The COT report (Commitment of Traders) for August 9 logged a sharp increase in both short and long positions. However, the number of short positions turned out to be bigger, which indicated the gradual end of the bear market and an attempt to find the bottom after reaching the parity level. Last week, US fresh macro stats were released, which turned everything upside down. The CPI report showed the first slowdown in inflation after reaching a peak of 10.0%. It fueled demand for risky assets. As seen on the chart, risk aversion soon returned to the market. Traders are unwilling to increase long positions due to the risks of a global recession. No crucial economic reports are expected this week that could facilitate the growth of the euro. Therefore, the euro is likely to stay in the sideways channel. There could hardly be sharp trend reversals before the fall of this year. The COT report revealed that the number of long non-commercial positions rose by 8,396 to 200,088, while the number of short non-commercial positions jumped by 4,121 to 234,624. At the end of the week, the total non-commercial net position, although it remained negative, climbed slightly to -34,536 from -39,811, signaling a shift to the bull market. The weekly closing price climbed to 1.0233 against 1.0206.
Signals of technical indicators
Moving averages
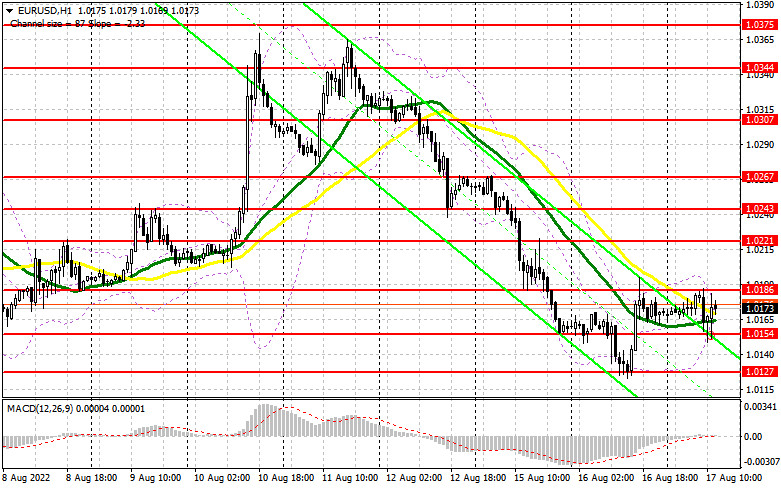
EUR/USD is trading near 30- and 50-period moving averages, which signals market uncertainty.
Remark. The author is analyzing the period and prices of moving averages on the 1-hour chart. So, it differs from the common definition of classic daily moving averages on the daily chart.
Bollinger Bands
In case of a rise, the upper border of 1.0180 will act as resistance.
Definitions of technical indicators
- Moving average recognizes an ongoing trend through leveling out volatility and market noise. A 50-period moving average is plotted yellow on the chart.
- Moving average identifies an ongoing trend through leveling out volatility and market noise. A 30-period moving average is displayed as the green line.
- MACD indicator represents a relationship between two moving averages that is a ratio of Moving Average Convergence/Divergence. The MACD is calculated by subtracting the 26-period Exponential Moving Average (EMA) from the 12-period EMA. A 9-day EMA of the MACD called the "signal line".
- Bollinger Bands is a momentum indicator. The upper and lower bands are typically 2 standard deviations +/- from a 20-day simple moving average.
- Non-commercial traders - speculators such as retail traders, hedge funds and large institutions who use the futures market for speculative purposes and meet certain requirements.
- Non-commercial long positions represent the total long open position of non-commercial traders.
- Non-commercial short positions represent the total short open position of non-commercial traders.
- The overall non-commercial net position balance is the difference between short and long positions of non-commercial traders.