empty
 
 
25.11.2022 10:49 AM
EUR/USD and GBP/USD technical analysis on November 25, 2022.

EUR/USD

This image is no longer relevant

Higher time frames

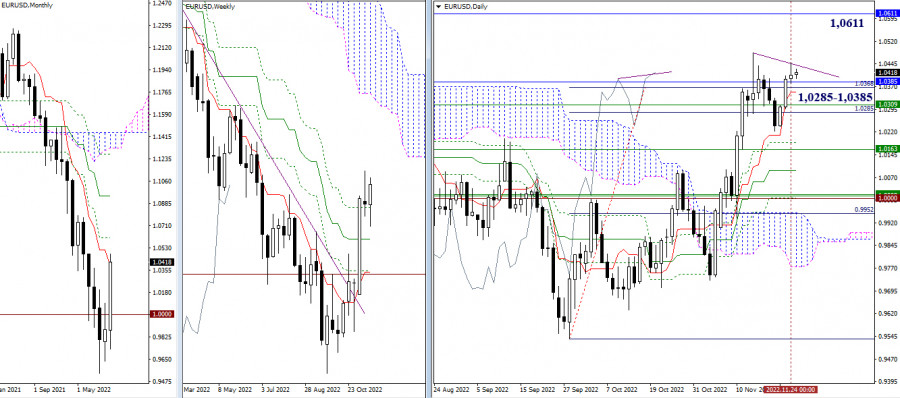
Yesterday, bulls failed to retest the high of the previous week (1.0481). The pair was going through a downward correction on the daily chart and began to form a divergence along the Chinoku line. Today is the last trading day of the week so the closing result is important. If the pair stays in the correction zone and confirms the divergence, the bearish sentiment may increase. Yet, to successfully activate the bearish scenario, the sellers will need to leave the support area of 1.0285 – 1.0385 where we can observe the accumulation of strong levels on higher time frames. In case the buyers manage to break above the above-mentioned range and retest the high, their next upward target will be the monthly level of 1.0611.

This image is no longer relevant

H4 – H1

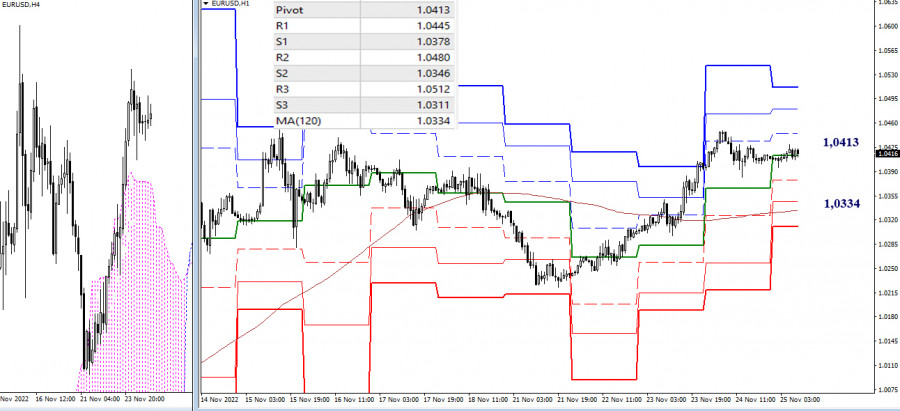
At the moment, the pair is going through a correction, with support found at the daily central pivot level of 1.0413. If the price extends its downward correction, the weekly support of the long-term trend at 1.0334 will become the main target for bears. This is the pivot level where the trend may reverse. Several interim supports are found at 1.0378 (S1) and 1.0346 (S2). If buyers manage to leave the correction zone, their upward targets will be located at 1.0445 – 1.0480 – 1.0512 (resistance at standard pivot levels).

***

GBP/USD

This image is no longer relevant

Higher time frames

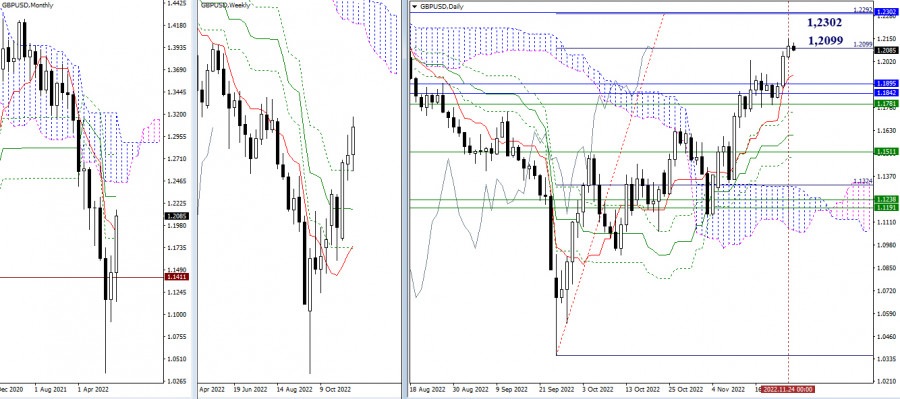
Yesterday, the pair attempted to test the first daily target and to break through the Ichimoku Cloud at 1.2099. The result of the price action will be clear soon. The next upward targets are found at 1.2292 – 1.2302 (a 100% test of the target + monthly medium-term trend). Today's support levels are 1.1946 – 1.1895 – 1.1842 – 1.1781 (levels on different time frames).

This image is no longer relevant

H4 – H1

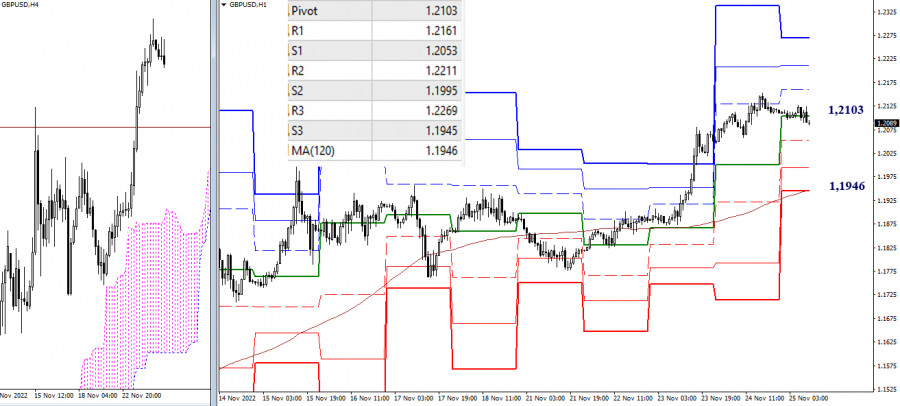
On lower time frames, the buyers are in control of the market. At the same time, the price is testing the central pivot level of 1.2103 in the course of a downside correction. If the price continues to fall, its main target will be the weekly long-term trend found at 1.1946. The interim support in this case will be at the levels of 1.2053 and 1.1995 (standard pivot levels). If the pair leaves the correction zone and resumes an uptrend, the resistance at standard pivot levels (1.2161 – 1.2211 – 1.2269) will again become relevant.

***

Technical analysis is based on:

Higher time frames – Ichimoku Kinko Hyo (9.26.52) + Fibo Kijun levels

H1 – Pivot Points (standard) + 120-day Moving Average (weekly long-term trend)

Evangelos Poulakis,
الخبير التحليلي لدى شركة إنستافوركس
© 2007-2024
كسب عائد من تغيرات أسعار العملات المشفرة مع إنستافوركس.
قم بتحميل منصة التداول ميتاتريدر 4 وافتح أول صفقة.
  • Grand Choice
    Contest by
    InstaForex
    InstaForex always strives to help you
    fulfill your biggest dreams.
    انضم إلى المسابقة
  • إيداع الحظ
    قم بإيداع 3,000 دولار في حسابك واحصل على $8,000 وأكثر من ذالك!
    في مايو نحن نقدم باليانصيب $8,000 ضمن حملة إيداع الحظ!
    احصل على فرصة للفوز من خلال إيداع 3,000 دولار في حساب تداول. بعد أن استوفيت هذا الشرط، تصبح مشاركًا في الحملة.
    انضم إلى المسابقة
  • تداول بحكمة، اربح جهازا
    قم بتعبئة حسابك بمبلغ لا يقل عن 500 دولار ، واشترك في المسابقة ، واحصل على فرصة للفوز بأجهزة الجوال.
    انضم إلى المسابقة
  • بونص 100٪
    فرصتك الفريدة للحصول على بونص 100٪ على إيداعك
    احصل على بونص
  • بونص 55٪
    تقدم بطلب للحصول على بونص 55٪ على كل إيداع
    احصل على بونص
  • بونص 30٪
    احصل على بونص 30٪ في كل مرة تقوم فيها بتعبئة حسابك
    احصل على بونص

المقالات الموصى بها

لا تستطيع التحدث الآن؟
اطرح سؤالك في الدردشة.
Widget callback